Introduction
The production possibility curve (PPC) is a curve which shows the maximum combination of two goods say Good X and Good Y that a country or an individual Can produce given its state of technology and the amount of resources in a given period of time. The Production possibility curve can also be known as the production bouandary/frontière, Opportunity cost curve or transformation curve. In the construction of a PPC, the following assumptions are to be considered.
1. The quantities of available resources are fixed
2. Only two types of goods are being produced and consumed. ie. Consumer goods and Capital goods.
3. The technological state is considered to be constant
4. The economy has reaches the full employment of her resources
5. Resources are sustainable at the margin
How to plot a Production possibility curve
i. Reverse one side of the table and allow the other side. That simple means that one side of the table of values should be in ascending order of value while thé other side should be in descending order.
ii. Adjust the production combination by making the descinding figure to stard with zero. This is so because the X and the Y-axis originate from the origin.
iii. Plot the adjusted combinaisons.
iv. Connect the plotted points with a smoth line begining with one extreme and and ending with the other and this will give the Production possibility curve.
Types of Production possibility curves (PPC)
The Production possibility curve can be braodly splitted into three types which include the following
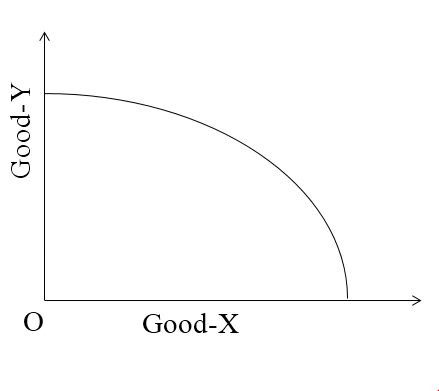
I. CONCAVE PRODUCTION POSSIBILITY CURVE
The concave PPC is used to illustrate increasing opportunity cost or resources are less efficient in the production of alternative than in the production of the original use. It can be illustrated as follows.
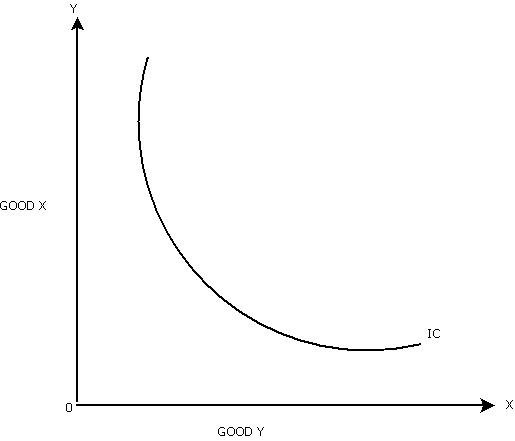
II. THE CONVEX PRODUCTION POSSIBILITY CURVE
This is the shape of the Production possibility curve that shows decreasing opportunity cost. This type of PPC implies that all the units of resources are more efficient in the production of one good as shown below.
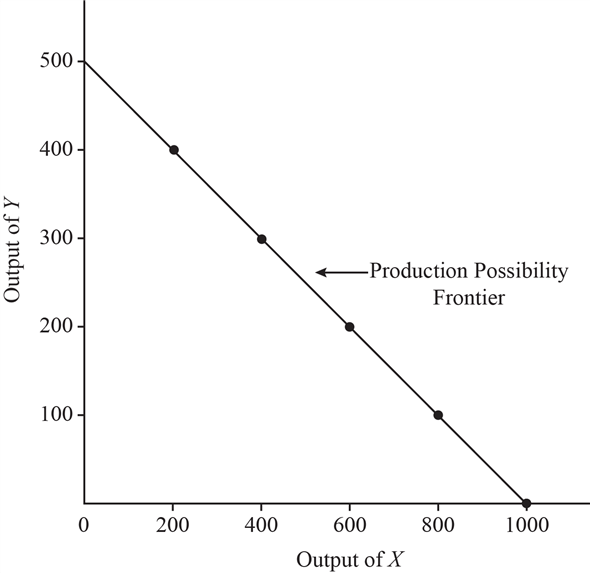
III. STRAIGHTLINE PRODUCTION POSSIBILITY CURVE
This curve shows constant opportunity cost of resources whic are equally efficient in the alternative. ie Resources are perfectly adaptable as illustrated on the diagram below